

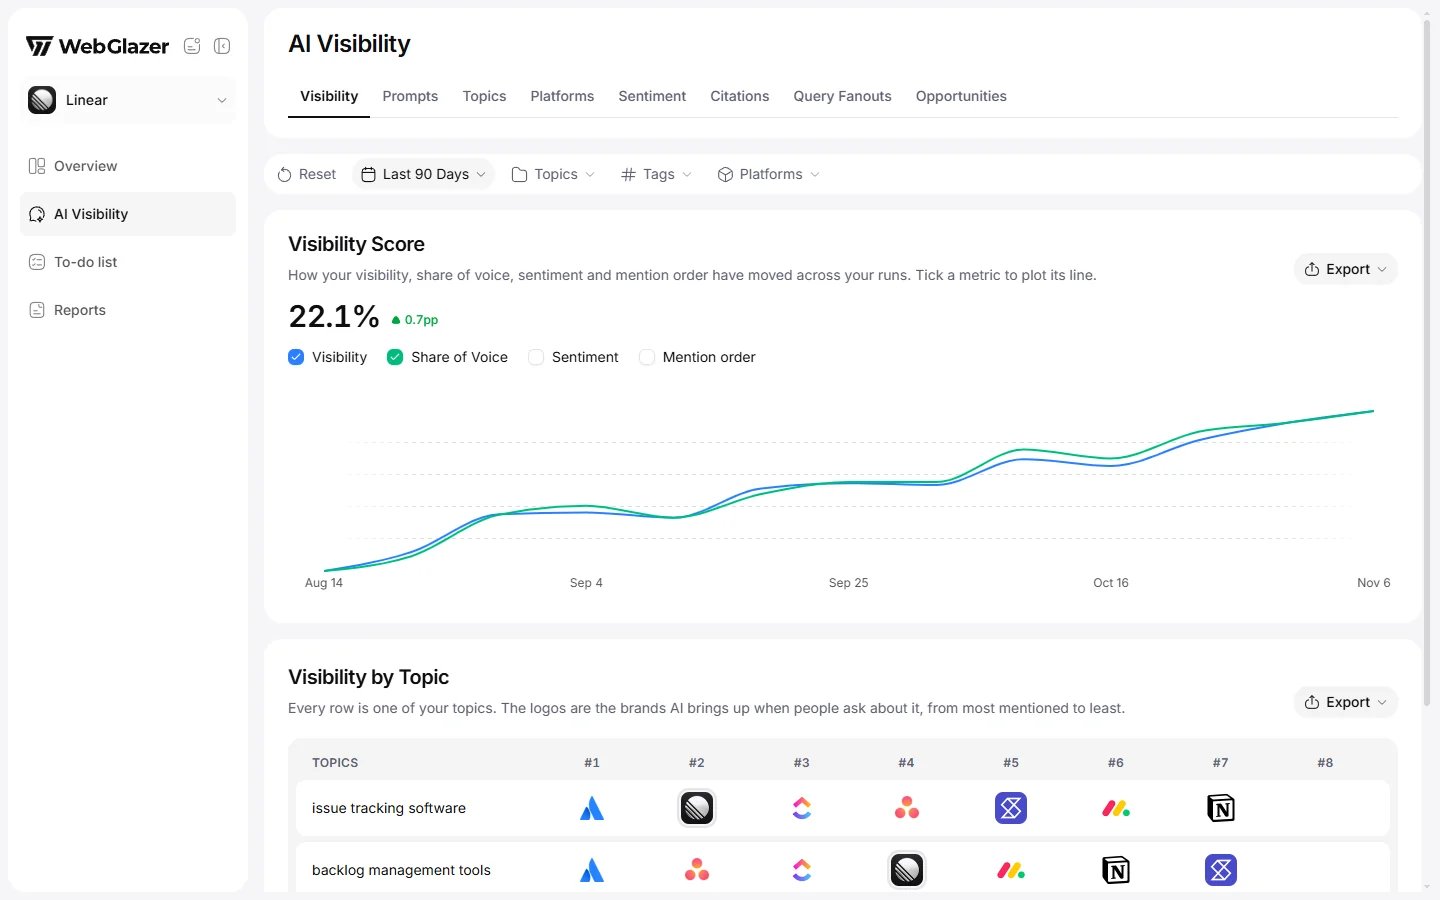
Sample data based on a linear.app project
Tabs and filter bar
AI Visibility has eight tabs: Visibility, Prompts, Topics, Platforms, Sentiment, Citations, Query Fanouts and Opportunities. The filter bar under them (date, Topics, Tags, Platforms, Reset) is shared by all tabs, so a selection carries over when you switch. See Overview for what each filter does. On this tab the branded topic and the Branded tag are hidden, because every number here is a rate that branded answers cannot produce.Visibility Score
“How your visibility, share of voice, sentiment and mention order have moved across your runs. Tick a metric to plot its line.”- The big number is your Visibility for the selected period and filters.
- The chip next to it is the change in percentage points (pp) against the previous period of the same length. If there is nothing to compare with, it says so.
- Metric checkboxes: Visibility, Share of Voice, Sentiment and Mention order. Visibility and Share of Voice are ticked at first. Tick a box to add its line. At least one line always stays on. A box only shows for a metric that has data in the period.
- The chart has no Y axis on purpose. The four metrics use different scales, so each line is stretched to the full height to show its shape. Hover a point to read the real values. The Mention order line is flipped, so up always means better on every line.
- Points per period: one point per day for ranges up to 35 days and for All time, one per week up to 120 days, one per month above that. Several runs on one day are pooled into one point. Days without a run are skipped.
- With a single run in the period you see bars instead of lines. With none, “Not enough runs yet”.
- Export downloads the points as CSV or JSON with the columns Date, Visibility %, Share of Voice %, Sentiment and Mention order.
Visibility by Topic
“Every row is one of your topics. The logos are the brands AI brings up when people ask about it, from most mentioned to least.”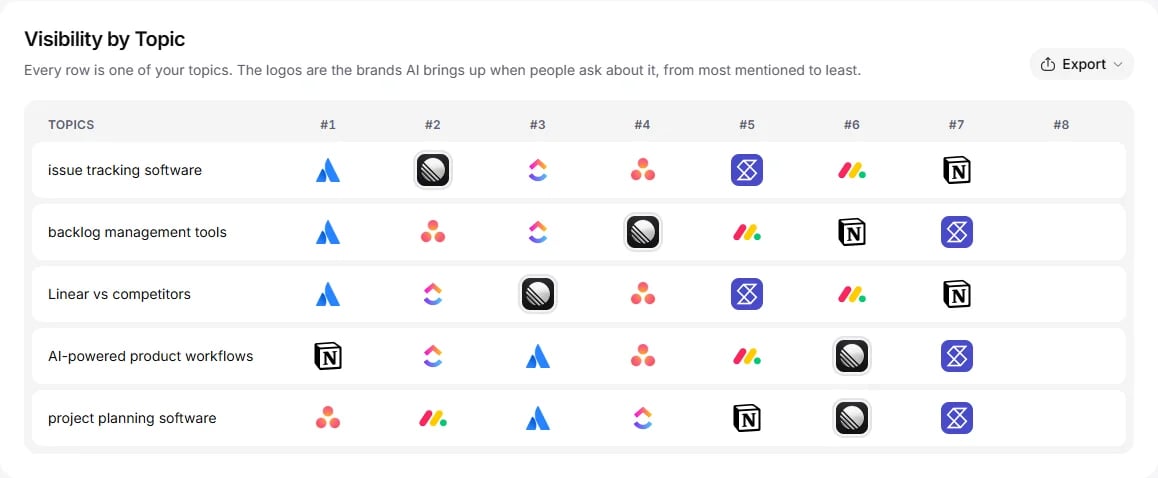
Sample data based on a linear.app project
- Each row is one topic. Columns #1 to #8 hold the brands ranked in that topic, best first. Your own brand’s logo has a double outline so you can spot it down each column.
- Hover a logo to see the brand name.
- Topic rankings use the same order as Rankings on Overview, applied to that topic’s answers. Every tracked brand AI names ranks here, with no minimum number of answers. Brands you do not track are left out. See Competitors.
- If a brand is hidden by a filter, its slot stays empty instead of shifting the others left.
- Export downloads one row per topic with the brand name in each slot.
- On a phone, each topic collapses to a card with its top brands.
Empty states
- “No visibility data yet” means no answer in the period could be counted. It fills in after your next daily run.
- “No runs match your filters.” means no run falls inside the filters. Reset them.