

Filter bar
The bar at the top sets the scope for every number on the page.- The date pill: Last 7 Days (the default), Last 30 Days, Last 90 Days, Last 6 Months, Last 12 Months, All time, or Custom range to pick days on a calendar. Every number is calculated over all runs in the range.
- Topics: limit the page to one topic, or All topics.
- Tags: limit the page to prompt types (search intents), for example Informational, Consideration or Transactional. Older runs can also carry older tags, such as Commercial, Navigational, Comparison or Post-purchase, and these show in the picker too.
- Platforms: limit the page to one or more AI engines.
- Reset: shows once you change anything, and puts every filter back to its default.
Visibility Over Time
A chart of how often AI mentions each of the top 10 brands from Rankings. It has two views, switched with the toggle in the card’s top corner: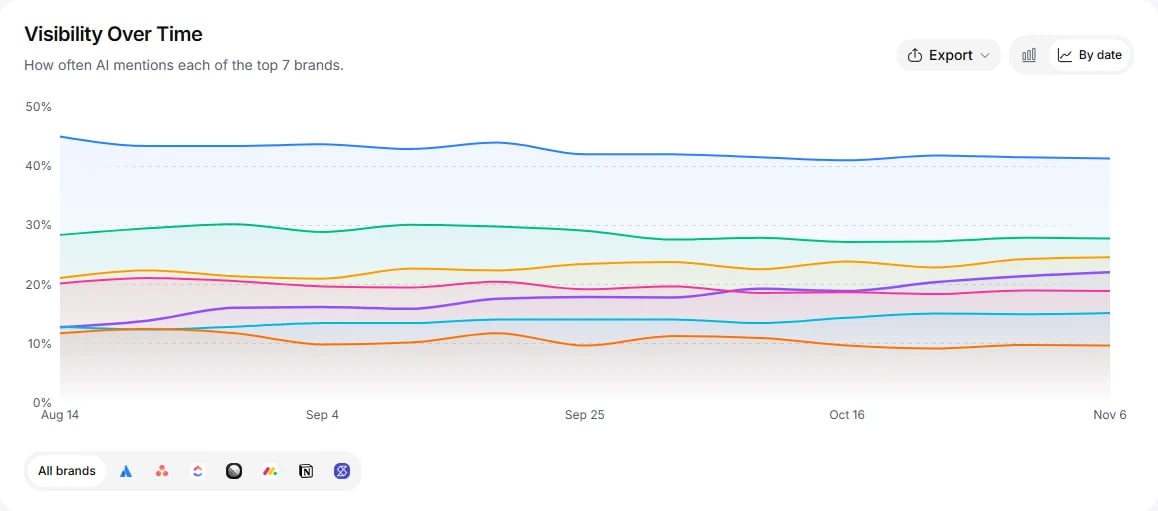
Sample data based on a linear.app project
- By brand (the default): one bar per brand, showing its Visibility for the whole period. This answers “who is ahead right now”.
- By date: one line per brand across the period. This answers “how has it moved”. It needs runs on at least two dates; otherwise it says “Not enough runs in this period to chart a trend”.
Rankings
“Brands ranked by how often AI mentions them.” One row per brand: your own brand and the competitors you track. A brand AI names that you do not track is not listed. Accept it in Settings > Brands to add it. See Competitors.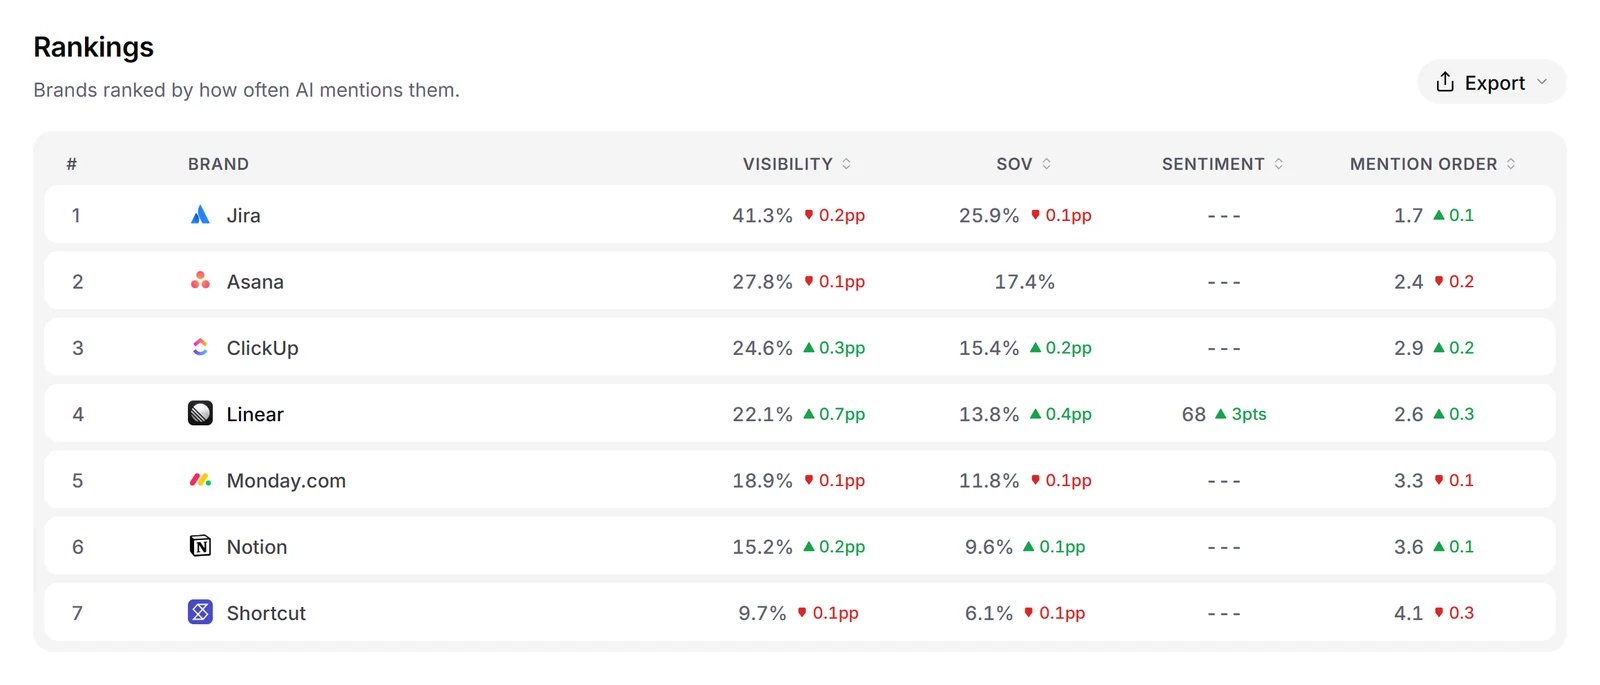
Illustration with sample data
How brands are ranked
The default order is set by WebGlazer, not by the browser:- Higher Visibility first.
- On a tie, higher Share of Voice.
- Then more answers naming the brand.
- Then the better (lower) Mention order.
- On a full tie, your own brand first, then by name.
Sorting, change chips and export
- Click a column header to sort by it. Each click cycles ascending, descending, off. Sort a second column to break ties in the first. The # rank stays with each brand.
- Change chips compare with the previous period of the same length, for example the 7 days before the current 7 days. All time has no chips. If the previous period has no data, you see a “no comparison” note instead.
- Use Export to download the table as CSV or JSON.
- With more rows than one page holds, use the pager under the table.